

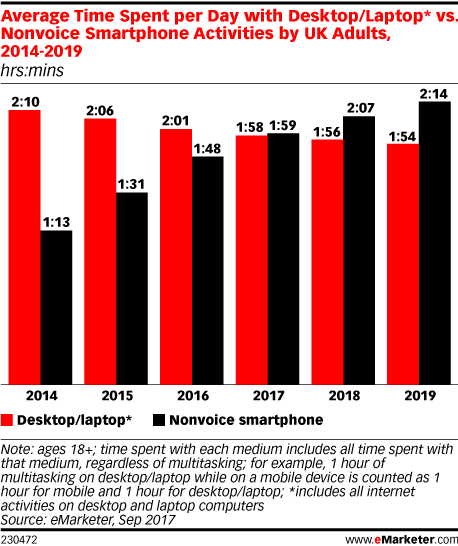
According to eMarketer.com, 2017 saw mobile web traffic overtake desktop traffic in the UK.
They predicted that this year, adults in the UK will spend over two hours each day on their smartphones. The below chart shows the development of mobile v desktop over the last few years.
This fact underlines how important it is to know the landscape, whatever your business or website might be. When dealing with video content, this becomes an even more important angle to address:
"Adults in the UK will spend an average of nearly 32 minutes per day watching digital video on a mobile device in 2017, up 13.5% from last year."
Here are some mobile landscape facts and statistics from the UK.
The most popular smartphone in the UK is still the iPhone 7
When we looked at the most popular smartphones of 2018, the iPhone 7 was still in the lead, despite losing 0.31% from Q3 to Q4.
The iPhone 6 and SE are still widely used, enjoying 6.02% and 6.55% respectively.
Samsung's Galaxy S8 was best placed of the Android devices, and the S7 and S7 Edge also made the top 12.
| Country | Position | Phone model | Traffic Share |
|---|---|---|---|
| UK | 1 | iPhone 7 | 12.86% |
| UK | 2 | iPhone 6S | 8.09% |
| UK | 3 | iPhone SE | 6.55% |
| UK | 4 | iPhone 6 | 6.02% |
| UK | 5 | iPhone 8 | 5.20% |
| UK | 6 | Samsung Galaxy S8 | 4.89% |
| UK | 7 | iPhone 7 Plus | 4.65% |
| UK | 8 | iPhone X | 4.18% |
| UK | 9 | iPhone 8 Plus | 3.47% |
| UK | 10 | Samsung Galaxy S7 | 3.20% |
| UK | 11 | iPhone 5S | 2.76% |
| UK | 12 | Samsung Galaxy S7 Edge | 2.50% |
When we looked at the smartphone upgrade cycle, we saw the iPhone 7 holding firm, and increasing in usage across 2018.
There were significant gains for the iPhone 8 and X too, while the iPhone 6 lost 1.24% share over the year.
The upgrade trends were reflected on the Galaxy side too, although the older two devices in the set - the S6 and S7 - both lost share.
The Galaxy S8 gained a small 0.56%, and the S9 made decent inroads after its launch in March, finishing the year on a healthy 2.3%.
iOS is the most popular mobile operating system
Following on from their dominance in the device landscape, iOS is obviously the most popular mobile operating system, too.
Windows Phone sits in third with 0.7% share, followed by RIM (0.06%) and Nokia OS (0.01%).
Below, we can see how the main two operating systems have fared over the last three years. After a positive 2017, Android has slipped further behind iOS over the last year, and now trails Apple's offering by 14%.
The most common screen size in the UK
Given the popularity of Apple devices, we expected to see 750x1334 top of the list.
| Screen resolution | Share | Average | |
|---|---|---|---|
| 1. | 750x1334 | 31.58% | 27.56% |
| 2. | 1080x1920 | 18.61% | 26.22% |
| 3. | 1440x2560 | 12.58% | 10.68% |
| 4. | 640x1136 | 11.99% | 6.67% |
| 5. | 720x1280 | 9.47% | 9.96% |
Smartphone hardware in the UK
RAM
We're yet to see higher-RAM devices make an impact in the UK.
6GB devices enjoyed 2.96% market share in Q4 2018, up 0.5% from Q1, while 8GB smartphones ended the year on 0.13%. Both these figures will increase during 2019 as manufacturers release higher-spec flagship models, like the Samsung Galaxy S10 which is rumoured to offer between 6 and 12GB across the range.
| RAM | Share | Average | |
|---|---|---|---|
| 1. | 2GB | 41.42% | 38.21% |
| 2. | 3GB | 18.38% | 24.12% |
| 3. | 4GB | 15.82% | 15.34% |
| 4. | 1GB | 15.64% | 13.48% |
| 5. | 1.5GB | 4.01% | 4.06% |
GPU
| GPU Name | Share | Average | |
|---|---|---|---|
| 1 | PowerVR GT7600 | 19.32% | 16.73% |
| 2 | PowerVR GT7600 Plus | 13.83% | 12.18% |
| 3 | PowerVR GX6450 | 9.05% | 9.05% |
| 4 | Mali-G71 MP20 | 7.23% | 1.51% |
| 5 | Adreno 530 | 5.75% | 7.40% |
CPU
| CPU Name | Share | Average | |
|---|---|---|---|
| 1. | Twister | 17.60% | 14.37% |
| 2. | Hurricane & Zephyr | 16.92% | 18.15% |
| 3. | Cortex-A53 | 12.75% | 14.37% |
| 4. | Monsoon & Mistral | 14.01% | 6.64% |
| 5. | Typhoon | 8.24% | 7.77% |
For more mobile landscape and device data, visit the DeviceAtlas Data Explorer.
Download the latest Mobile Report
Bringing you the latest developments on the global device landscape.
All statistics represent the share of web traffic in selected countries based on mobile visits tracked by DeviceAtlas.
