


Web Analysers Traffic Breakdown
In part 1 of our Web Analytics Comparison: Analysing the Web Analysers post, we presented research findings from our two-week subscription to 4 different web analytics services. We noted a significant difference in traffic breakdown across the different solutions; in this post (part 2), we will cover this traffic breakdown discrepancy in more detail.
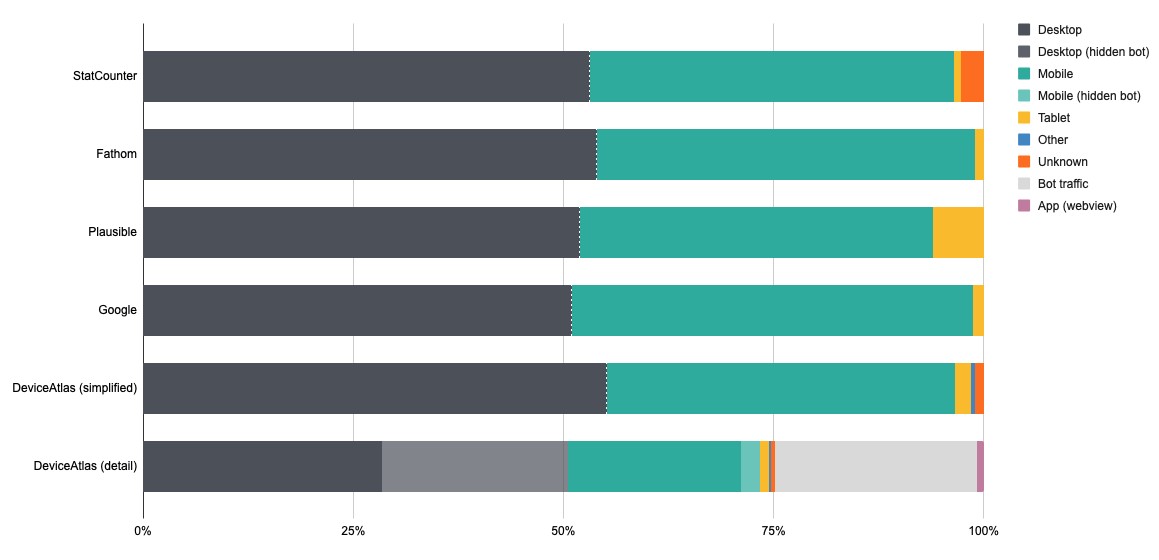
Plausible's tablet percentage is over six times higher than any of the other analytics services. This is due to a stated methodology of categorising tablets by screen width (this is an unreliable rubric in a world of widely varying resolutions, form factors and folding devices).
Running blind
Another disparity exists between the DeviceAtlas desktop/mobile traffic breakdown and the other web analytics services being researched. How can such a big difference be explained? Well, it can be explained by exposing a fundamental shortcoming of third-party web analytics companies.
It’s well known that web analytics services rely on a snippet of JavaScript to capture analytic events data before sending them back to base for analysis. Unfortunately, not all browsers run JavaScript and some privacy tools block selected JavaScript scripts. In response, analytics solutions are sometimes configured to use a static image instead of a JavaScript snippet, either as a fall-back mechanism or as the primary integration method.
What can complicate things further is the fact that this fall-back method of using a static image isn’t always effective. Let’s take a look at what happens when you load a typical web page:
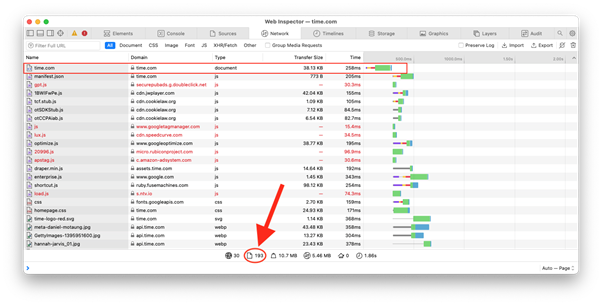
Of the 193 separate items downloaded by a typical browser in order to display this page, only the very first one is truly necessary to obtain all of the text content of the page. So, if you are operating a web scraper, and all you require is the text content of the page, you can save a lot of time, expense and bandwidth by not fetching the other 192 page resources—some of which are third party web analytics trackers.
All third-party web analytics solutions only work if the browser opts to download the fall-back image—any browser or bot that doesn't do so will remain entirely invisible to analytics services. In other words, there is simply no way to record such an event as a third-party without access to the web server log file.
Dark traffic
Ironically this means that, while modern web analytics services are extremely convenient and feature rich, they cannot have a complete picture of the traffic, an unfortunate regression with respect to server-side packages such as Webalizer, AWStats and Analog in the early days of the web.
Does this matter? Quite possibly. Any entity claiming to be a desktop or mobile browser that fetches the HTML of a page but opts to leave out all the linked assets is almost certainly not being used by a human and is more likely a bot of some description. A bot’s rationale for fetching page HTML is difficult to determine with confidence, but one likely reason is content scraping.
This traffic may or may not matter to websites, but it certainly seems prudent to maintain awareness of this because: 1) it may be costing money to serve 2) it could indicate malevolent activity e.g., probing for security breaches or content scraping. Different sites will see varying levels of this dark traffic – in our case this accounted for roughly 25% of all traffic measured by sessions (where a session was a group of requests sharing the same IP address, user-agent string and date of request). This is a significant enough level to warrant oversight.
Mendacity and misrepresentation
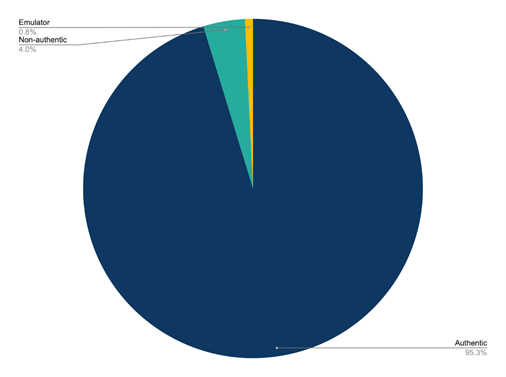
We have talked about dark traffic but there is another layer of complexity worth mentioning also: not all web traffic is what it says it is. Our DeviceAssure solution can determine if a mobile or tablet device is what it claims to be.
How common is this misrepresentation? In the test period under consideration, 4.9% of mobile devices visiting our test website were not what they claimed to be. About 14% of this 4.9% of traffic was a straightforward case of an emulator emulating a phone. The underlying cause of the rest is more difficult to guess at but is a clear case of misrepresentation—something claiming to be a particular mobile device, but with properties that don’t align with the claim.
Like walking into a bank wearing a disguise, misrepresentation is often an indicator of malevolence. At the very least it is something that businesses should monitor. Web analytics services would serve their customers well to surface this kind of traffic—a spike in misrepresenting traffic is likely a leading indicator of a problem.
Conclusion
Currently, web analytics services cannot confidently report on all web traffic visiting a site. Perhaps it is prudent to offer more transparency to customers surrounding the diversity of the Internet today, and more specifically the ambiguity regarding device detection. Many site owners do not realise that their web analytics service provider is not fully accurate in measuring website visits. The Internet is vast, and many unknowns exist outside of what Google Analytics, Plausible, Fathom and StatCounter report on.
DeviceAtlas provides clients with an accurate breakdown of web traffic by device, as well as better visibility of bots visiting their site. Get in touch with us to find out more about our solution or sign up for a free trial.
Notes on methodology
We set up 4 web analytics services to measure traffic on one of our websites
- Google Analytics
- Plausible
- Fathom
- StatCounter
Apart from Google Analytics (which is free of charge) paid accounts were utilised.
The respective analytics scripts were set up to run across the entire website for a period of over six months between 2021 and 2022 before a data snapshot was taken for a two week period in January 2022. The default recommended integration mechanism was used in all cases.
DeviceAtlas analysis
Separately, we also analysed the raw web server access logs using DeviceAtlas. This approach leads to some obvious scope for differences to arise:
All of the web analytics services tested utilised a JavaScript integration method (as is standard) which immediately limits their view to full-featured web browsers and a small number of crawlers. The server logs by contrast see all traffic to the site regardless of the originator. Web analytics services typically measure traffic by page view, site view or session. Web server logs list every request made, and thus don't allow for a clean grouping of requests associated with a page view or session.