


Analysing visitor traffic is important to determine the health of a website. In this article, we present the findings from our research of four different analytics services (Fathom, Google Analytics, Plausible and Statcounter) and how they measured the web traffic of a particular domain. This data was then compared with DeviceAtlas, a specialised device identification service.

Where are the devices people use?
Website activity is generally measured by the number of sessions, site views or page views served by the site over a given time period. But where are these views coming from? The web is visited by a vast spectrum of visitor types, both human and bot generated. Human traffic is conducted via an ever-widening set of device types; non-human traffic covers such a spectrum of types and intentions that it merits an article all by itself.
When the web was invented in 1989, the only device type available was the desktop PC. This situation persisted for the first decade or so until the advent of mobile data connectivity triggered a Cambrian explosion of device types that still shows no signs of slowing. Today it's possible to access websites on wristwatches, car media systems, TVs, VR headsets and set top boxes in addition to the usual suspects such as phones, tablets and PCs. In fact, many websites see more traffic now from device type that didn’t exist when the web was invented, than they do from PCs.
Given this reality, one would expect that web analytics services have evolved to reflect this diversity. However, this wasn’t the case for the services involved in this research.
Broadly speaking, web analytics services tend to divide web traffic into three categories: desktop, tablet and mobile. But what if you want to identify how many people are viewing your website from VR headsets or set top boxes? No such luck—they all disappear into the disparagingly named "other" category…if they are counted at all!
Does this matter? We think so. In the two-week sample period considered, and in addition to the usual desktop and mobile traffic, DeviceAtlas recorded traffic from the following device types:
- Set top box (Fire TV Stick 4K, Fire TV Stick 3rd Gen, Fire TV Stick)
- TV (LG NetCast Smart TV, Fire TV Element 4K, generic Android TV)
- Media player (all iPod Touches)
- Wristwatch (all Samsung Gear S3 Frontiers)
- Vehicle multimedia system (all Tesla cars)
- Games console (Playstation 4, Nintendo DSi)
Unfortunately, none of this traffic was identified by the 4 web analytics services. This means that if a business was reviewing its own traffic using any of these web analytics services, they would have no knowledge of such devices visiting its website. To some extent this is understandable considering that the traffic levels were small, but it can still have a negative impact if web content is not optimised for these visiting devices.
Let’s look at some of the more traditional device categories and how they were measured by each of the analytics services. The below chart displays the breakdown of traffic by each of the four services considered, as well as the DeviceAtlas. Observant readers will no doubt be curious about the differing traffic breakdowns across the analytics solutions—in part 2 of this article (Dark Traffic and Misrepresentation), we explore this device discrepancy in more depth.
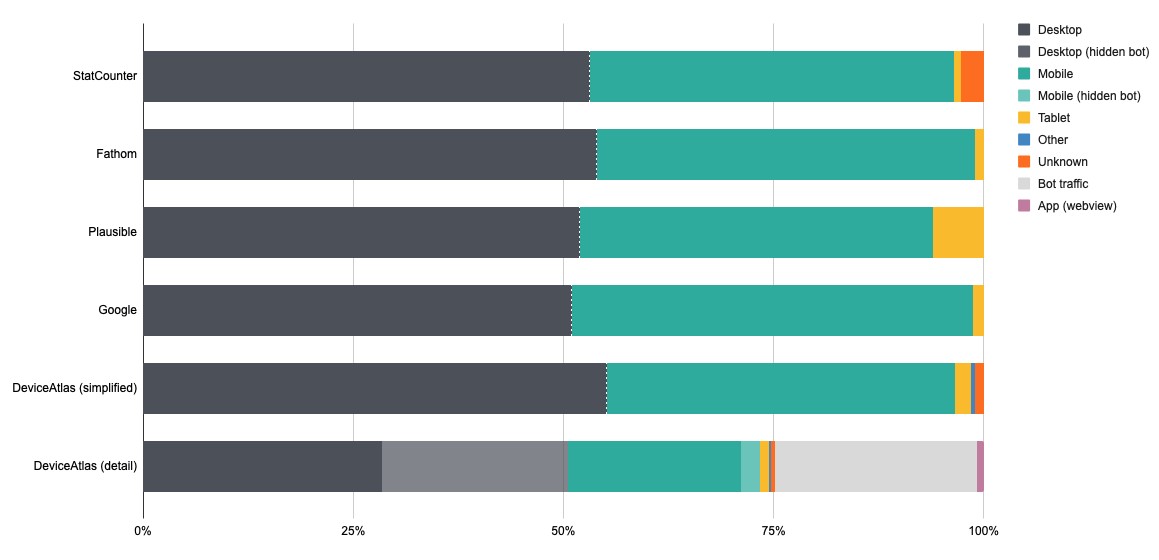
Note: Plausible's tablet percentage is over six times higher than anybody else's due to a stated methodology of categorising tablets by screen width-this is an unreliable rubric in a world of widely varying resolutions, form factors and folding devices.
Too much detail, not enough detail
Whereas device types beyond mobile and desktop are deemed not worthy of recording, Google Analytics identifies phone model details to the point of insignificance. During our test period it subdivided similar model names of mobile devices-five variants of the Samsung Galaxy S21 (SM-G9910, SM-G991B, SM-G991N, SM-G991U, SM-G991W), four variants of the S21+ and three variants of the S21 Ultra. This separation of almost all identical models makes for an overly verbose analysis that may be difficult to grasp.
In contrast to this arguably excessive detail about Android devices, all iPhone and iPad models (typically the single biggest source of traffic) are lumped into a single device category, which makes little sense. If there was a need to identify which traffic was using a recent iPhone model, none of the four web analytics services would record this. Everything from the very first iPhone (launched over 15 years ago) to the latest iPhone 13 Pro Max is categorised simply as "Apple iPhone"-a curious limitation. Similarly, the latest 12.9” iPad Pro, a hugely powerful device, is treated the same as a first-generation iPad Mini—a barely functional web citizen.

Where are the mobile apps?
Another lost opportunity is the lack of insight into how much web traffic originates from mobile apps such as Facebook, Reddit and Twitter—all increasingly popular platforms to view web pages from. And what about website previews displayed by WhatsApp, iMessage etc. when a link is sent via text?

Surely site owners would like to know how often this happens and measure how many previews turn into website visits? Again, no such luck—web analytics services seem to be stuck in an era where everything is cleanly divisible between mobile and desktop, where apps don't exist and where there is no such thing as website previews.
Where are the bots?
Bots constitute a large percentage of web traffic for most websites, with as much as 40% of site traffic coming from non-human visitors.
Bot traffic varies from essential (search engine crawlers) to outright malicious. Either way it’s important that this traffic is considered. Site owners need traffic from search engine crawlers to be found on Google, Bing, etc. but it’s important to control traffic from malicious bots e.g., for security exploits or illegal content scraping.
Despite bots often being the single largest component of web traffic, web analytics services typically hide this traffic entirely, positioning this stance as a ‘feature.’ They offer no way for site owners to check that they are being crawled by Google, Bing and Yahoo et al, nor do they offer any overview of other crawler activity that might be important.
The following graph shows just the top twenty (of 196!) non-human visitors identified by DeviceAtlas for our test period:

Note that the Google crawler is way down at position 13 on the list. DeviceAtlas maintains a list of some of the more popular user agent strings (including popular bots) on our List of User-Agent strings page.
Conclusion: lost opportunities and stasis
In some ways, web analytics services have evolved in leaps and bounds—you can understand a lot more about acquisition, bounce rate, engagement, monetisation and retention than ever before. You can also slice and dice the metrics in any conceivable way. But to focus on these attributes is to neglect an opportunity—an opportunity to think about reaching entirely new customer types and contexts that the web now supports. The web is no longer restricted to mobile and desktop. Additionally, it’s time to acknowledge that humans are not the only entities plying the web: like them or not, bots and agents are essential participants of our ecosystem that should also be monitored and managed.
These analytics services could be doing a much better job for their customers by reflecting the diversity, the reality—and the possibilities—of today’s web.
Notes on methodology
We set up 4 web analytics services to measure traffic on one of our websites
- Google Analytics
- Plausible
- Fathom
- StatCounter
Apart from Google Analytics (which is free of charge) paid accounts were utilised.
The respective analytics scripts were set up to run across the entire website for a period of over six months between 2021 and 2022 before a data snapshot was taken for a two week period in January 2022. The default recommended integration mechanism was used in all cases.
DeviceAtlas analysis
Separately, we also analysed the raw web server access logs using DeviceAtlas. This approach leads to some obvious scope for differences to arise:
All of the web analytics services tested utilised a JavaScript integration method (as is standard) which immediately limits their view to full-featured web browsers and a small number of crawlers. The server logs by contrast see all traffic to the site regardless of the originator. Web analytics services typically measure traffic by page view, site view or session. Web server logs list every request made, and thus don't allow for a clean grouping of requests associated with a page view or session.