

Smartphones using Firefox OS, Sailfish OS, or Ubuntu OS are generally available but purchasing them may not be an easy task. Today the mobile world is entirely dominated byAndroid and iOS. Check out the latest statistics which focus on comparing Android vs iOS during the whole of 2015. The stats are based on website visits from mobile devices.
Android devices sold better in 2015
In terms of sales Android has gained share across most countries. The latest stats by Kantar Worldpanel show that in Q3 2015 iOS had 29.2% market share in the USA, while Android’s share was over twice that at 65.9%. In the EU5 countries the difference between the two leading operating systems was even greater at 14.4% (iOS) vs 74% (Android).
If you’re looking for stats on sales of different mobile operating systems, you probably won't find them but you may as well just check out what’s on offer. Today it is very difficult to purchase a phone that is not an iPhone or an Android-based device. Windows Phone-based models can be found rather easily but the offer is limited to only several low-end phones with the only exception of Lumia 950 and 950XL. Getting a different OS, such as Firefox OS, Tizen OS, Sailfish OS or Ubuntu, is possible but in most countries it requires searching through some niche online stores and auctions.
Android vs iOS based on browsing stats
Of course shipment statistics may not represent device installed base because some of the devices won’t actually reach consumers. Users of different operating systems may have different browsing habits.
Our device usage data shows how phone owners are actually using their devices given that it is based on website hits and not sales figures. Here is the Android and iOS web traffic share in selected countries between Q1 and Q4 2015 based on DeviceAtlas statistics.
iOS web traffic Q1 - Q4 2015:
Android web traffic Q1 - Q4 2015:
During the whole of 2015 iOS gained web traffic share in most countries we analyzed. This may be caused by a few different factors, including the growth of sales in general and, perhaps more importantly, introducing larger screen iPhones which make browsing on-the-go a more comfortable experience. It is quite likely that the owners of 4.7 and 5.5-inch iPhones browse much more than the owners of the 3.5 or 4-inch devices.
2015 was a bit worse for Android than for iOS in the markets we analyzed. Android lost some web traffic share in many large markets, such as USA and Germany.
Gains and losses
The fact that in 2015 iOS gained a bit more than Android in terms of web traffic share was especially visible in terms of ‘movers,’ -- the countries switching from majority Android to majority iOS.
In 2015 there were four countries which became majority iOS including Singapore, Kuwait, Norway and Sweden. Only one country, Russia, moved the other way round. However there were some markets where Android strengthened its leading position. The following table shows some selected markets where Android and iOS gained, or lost a significant amount of web traffic.
Gains in web traffic share (Q1 - Q4 2015)
| Android (change in traffic share) | iOS (change in traffic share) |
|---|---|
| Poland +12.17% | Sweden +12.8% |
| Russia +6.37% | Germany +6.93% |
| Brazil +2.57% | Japan +6.55% |
| Denmark +2.37% | USA +4.86% |
| Canada +1.95% | Spain +3.11% |
Losses in web traffic share (Q1 - Q4 2015)
| Android (change in traffic share) | iOS (change in traffic share) |
|---|---|
| Sweden -13.26% | Poland -16.97% |
| Germany -7.99% | Russia -9.86% |
| USA -4.68% | Denmark -4.54% |
| France -3.65% | Brazil -2.01% |
| Spain -2.74% | Canada -1.03% |
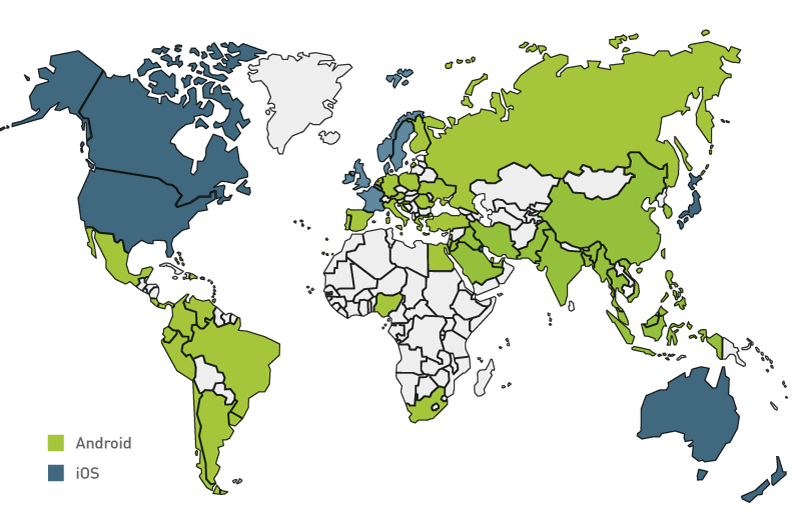
Also check out the following map showing countries dominated by either Android or iOS.