

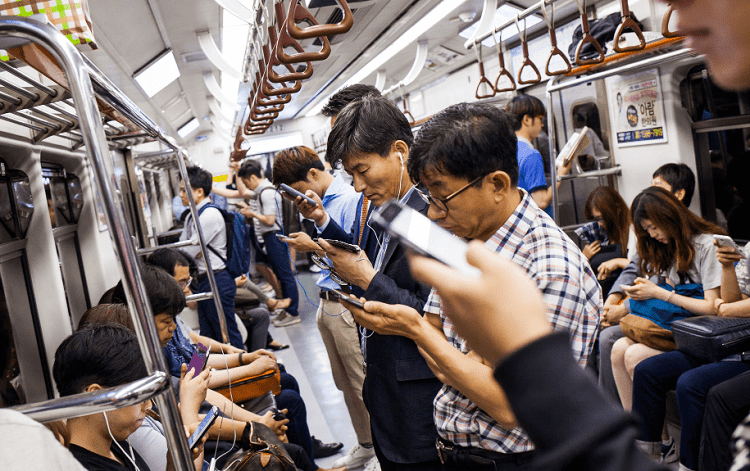
Smartphone penetration in South Korea is a whopping 95%, according to recent figures, with the remaining 5% use a mobile phone which doesn't offer internet access.
That makes it the only nation on Earth with 100% mobile phone ownership, with Israel the next highest on 88%.
With over 51 million inhabitants, that's a lot of potential customers and users no matter what product or service you offer. So, we've gathered some usesful statistics on the mobile landscape in South Korea.
Most popular Mobile OS in South Korea
Things are pretty close in the battle for OS dominance in South Korea, with the big two claiming a combined 98+% of the market. Windows Phone, RIM and Symbian accound for a combined 1%, with the remainder spread between Rex and proprietary versions of LG and Sony operating systems.
It's somewhat surprising to see iOS so close to Android here, given we're in the home of Samsung and LG.
The most popular smartphones in South Korea
The iPhone 7 Plus was the most popular smartphone in South Korea in 2018, with the 7 in second.
The iPhone X and 8 look set to overtake the 6S any time soon, while the most popular Android device is the Samsung Galaxy Note 8. There's a decent range of different Android manufacturers in South Korea, with devices from the likes of Google and LG claiming smaller shares of the market.
iPhone usage suffered a little towards the end of 2018, with none of the four models below following the same trend we saw elsewhere when investigating the smartphone upgrade cycle.
Q3 saw an end to growth in use of the iPhone 6, 8 and X, although the 7 continued to increase its share over the full year.
The Samsung Galaxy S7 suffered a sharp decline in popularity during the first half of 2018, while the S6 and S8 remained steady.
The Galaxy S9 began its climb, ending the year with a 1.1% share after pre-release orders began in March.
Smartphone screen sizes in South Korea
With Android enjoying 51.53% of the overall smartphone market share, we'd expect to see screen resolutions common to Android devices leading the list.
Compared with the average share across the 36 countries we examined, South Korea shows a higher presence of 1440x2560 devices (+8.6%) and HDR 1440x2960 (+3%). The latter, higher resolution is standard on the Samsung Galaxy S8 and S9 range as well as Apple's iPhone X, XS/Max and 8/Plus.
This would seem to comfirm the perception of the country as a leader and early adopter of all things tech.
| Screen resolution | Share | Average | |
|---|---|---|---|
| 1. | 1080x1920 | 29.21% | 26.22% |
| 2. | 750x1334 | 20.05% | 27.56% |
| 3. | 1440x2560 | 19.03% | 10.68% |
| 4. | 1440x2960 | 11.68% | 8.43% |
| 5. | 720x1280 | 5.38% | 9.96% |
Smartphone hardware in South Korea
As for smartphone hardware, South Korea's position as early adopter shows itself in the relatively high use of devices with 6GB - over 10%. The average in our data is 2.87% across 36 countries.
RAM
| RAM | Share | Average | |
|---|---|---|---|
| 1. | 2GB | 31.78% | 38.21% |
| 2. | 3GB | 29.31% | 24.12% |
| 3. | 4GB | 18.67% | 15.34% |
| 4. | 6GB | 10.04% | 2.87% |
| 5. | 1GB | 8.03% | 13.48% |
GPU
| GPU Name | Share | Average | |
|---|---|---|---|
| 1 | PowerVR Series 7XT | 12.96% | 8.95% |
| 2 | PowerVR GT7600 | 11.03% | 16.73% |
| 3 | Mali-T880 MP12 | 8.51% | 0.98% |
| 4 | PowerVR GT7600 Plus | 8.23% | 12.18% |
| 5 | PowerVR GX6450 | 6.45% | 9.05% |
CPU
| CPU Name | Share | Average | |
|---|---|---|---|
| 1. | Hurricane & Zephyr | 20.90% | 18.15% |
| 2. | Monsoon & Mistral | 16.81% | 14.01% |
| 3. | Twister | 15.17% | 14.37% |
| 4. | Kryo 280 | 8.96% | 6.64% |
| 5. | Cortex-A53 | 8.43% | 12.75% |
For more mobile landscape and device data, visit the DeviceAtlas Data Explorer.
Main Image By Angelo DeSantis via Flickr.