

We've just released the latest edition of our quarterly Mobile Traffic Report covering Q3 2015. Download the report to learn about the latest trends in the mobile world. Be sure to check out this edition’s statistics on the most popular MNOs in selected countries based on website hits.
Q3 2015 report’s findings
In every edition we choose an interesting theme that reveals some surprising facts about the mobile landscape today. In the Q2 2015 report we focused on the tablet traffic. You could learn about the most popular tablet makers, tablet OSes, tablet browsers, etc.
In the Q3 report we focus on the following aspects of the mobile world:
- Mobile Network Operators – the most used MNOs based on website hits
- Device diversity – the number of unique mobile OSes, vendors, phones, etc. in different countries
- Screen sizes and screen resolutions
- Most used mobile OSes, phone makers and phone models
For example, we learned that Vodafone tops the ranking in Germany with over 43% website hits in this country.
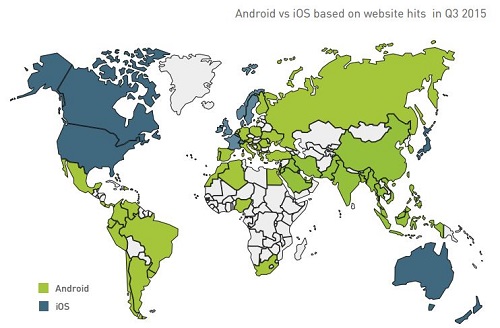
We also revealed where Android and iOS are the most popular mobile OSes which allowed us to build the following map.
Download the report to learn about your local market.
Objectives and methodology
Mobile Traffic Reports are based on visits to thousands of DeviceAtlas-powered websites from all over the world. The charts represent the percentage of all mobile web traffic in a given country generated by a certain kind of device.
For instance, the figure 7.49% for Samsung Galaxy S5 in Germany means that 7.49% of all visits in Germany came from Samsung Galaxy S5.
This is one of the very few reports that is based not on sales figures, estimates or surveys, but on real website traffic tracked by our device detection solution. The aim of the report is to help people working in the online space get better understanding of the fast-growing mobile landscape.
Feel free to download and share
Just click the button and fill in the form to download the report. You are most welcome to share the report’s findings with your audience.
