

![]()
We had a look into State-level data to see which mobile operating system is dominant across the United States, and if there are any correlations between Republican v Democrat and iOS v Android use.
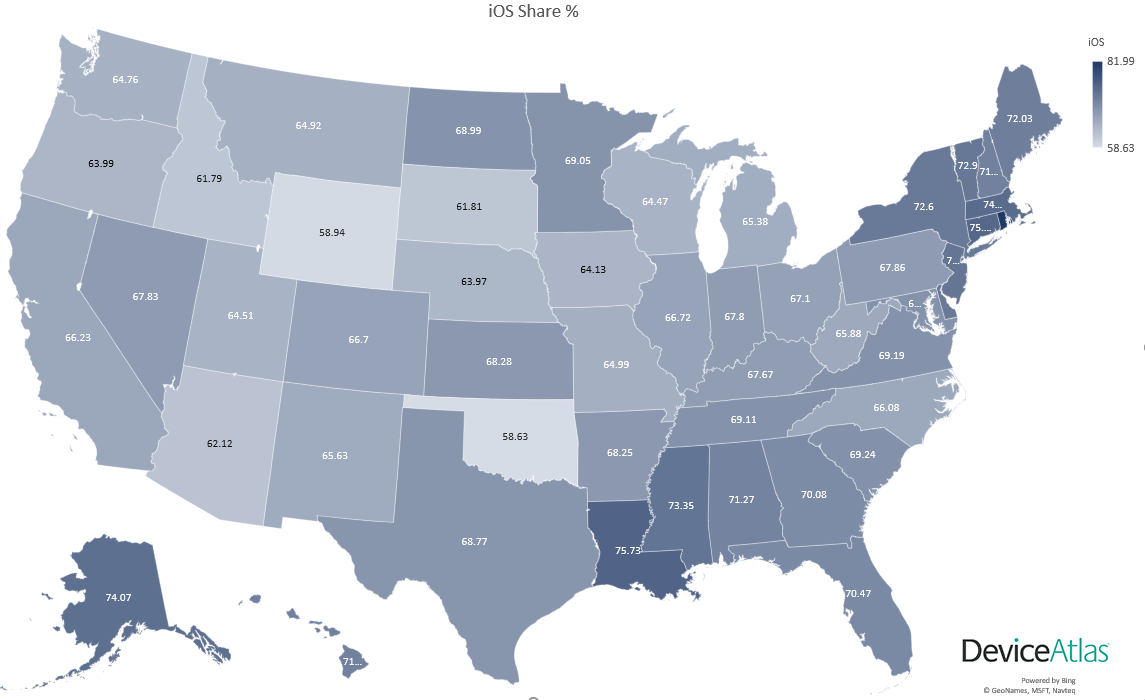
iOS is dominant across the US
We already knew this, having examined Android v iOS in the US. However, it's always interesting to break it down state-by-state.
(You can view the raw numbers here)
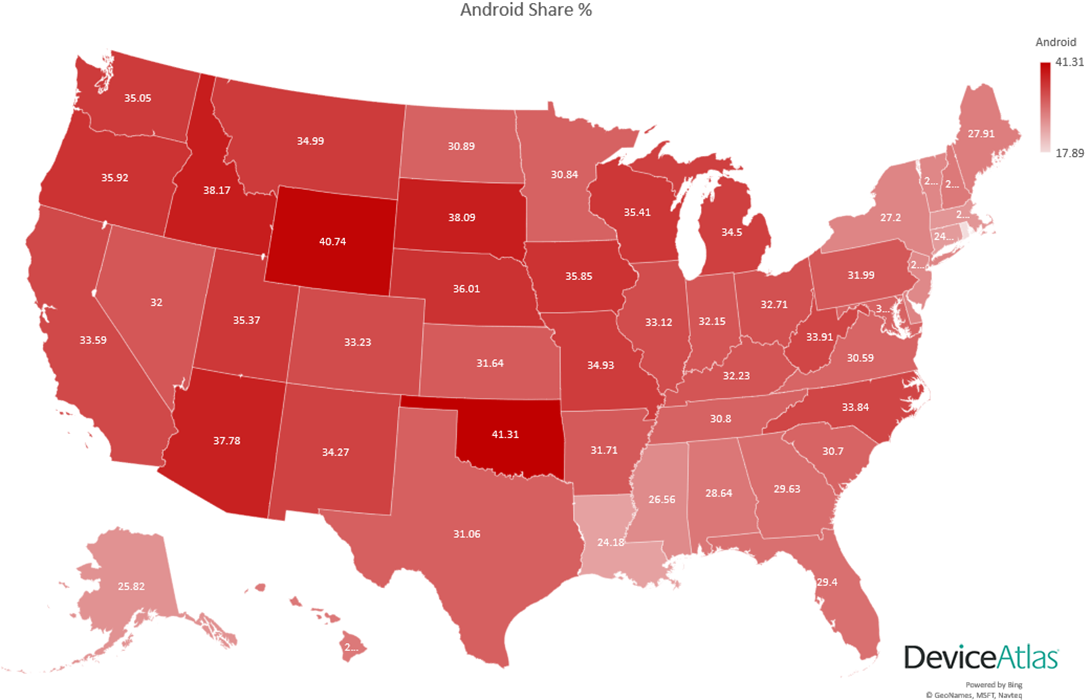
Below is the OS market share across the country during September 2018. Darker means more popular (click for a larger image).
iOS
Android
Do Democrats like iPhones more than Republicans?
With not every State voting in this Senate election, and a total of 435 seats up for grabs in the House vote, it's hard to see any standout State trends when compared to mobile OS usage.
So, we had a look at the results for the 2016 Presidential election and plotted State results against our latest data.
What we saw was a slight nudge towards iOS in the 14 states where the Democratic nominee (Hillary Clinton) received over 50% of the vote. iPhones have, on average, 70.66% OS share in these states.
Trump won over 50% in 23 States during the 2016 election, and in those, iOS dominance is down slightly to 67.16%.
So what does this mean? Increased purchasing power amongst blue-leaning Americans? A suspicious view of Silicon Valley tech in Red circles? We've no idea, and it's not something our data can tell us either, certainly not when we compare it to 2016's political landscape.
Which models do Apple fans use??
We also looked at data beyond Android v iOS and discovered which iPhone models are most in use in individual states.
The below charts indicate which iPhones are popular as a percentage of overall Apple use. We've chosen four - California (66.23% iOS share), New York (72.6% iOS), Texas (68.77% iOS) and Arizona (62.12% iOS).
There are some interesting trends on show. Apple users in California prefer the iPhone 7 Plus over the slightly smaller 7, whereas the opposite is true in New York.
The data - mobile OS by State
| State | iOS Share | Android Share |
|---|---|---|
| Alabama | 71.27% | 28.64% |
| Alaska | 74.07% | 25.82% |
| Arizona | 62.12% | 37.78% |
| Arkansas | 68.25% | 31.71% |
| California | 66.23% | 33.59% |
| Colorado | 66.7% | 33.23% |
| Connecticut | 75.09% | 24.81% |
| Delaware | 72.56% | 27.3% |
| District of Columbia | 64.12% | 35.49% |
| Florida | 70.47% | 29.4% |
| Georgia | 70.08% | 29.63% |
| Hawaii | 71.42% | 28.4%% |
| Idaho | 61.79% | 38.17% |
| Illinois | 66.72% | 33.12% |
| Indiana | 67.8% | 32.15% |
| Iowa | 64.13% | 35.85% |
| Kansas | 68.28% | 31.64% |
| Kentucky | 67.67% | 32.23% |
| Louisiana | 75.73% | 24.18% |
| Maine | 72.03% | 27.91% |
| Maryland | 69.19% | 30.75% |
| Massachusetts | 74.56% | 25.38% |
| Michigan | 65.38% | 34.5% |
| Minnesota | 69.05% | 30.84% |
| Mississippi | 73.35% | 26.56% |
| Missouri | 64.99% | 34.93% |
| Montana | 64.92% | 34.99% |
| Nebraska | 63.97% | 36.01% |
| Nevada | 67.83% | 32% |
| New Hampshire | 71.56% | 28.39% |
| New Jersey | 73.16% | 26.69% |
| New Mexico | 65.63% | 34.27% |
| New York | 72.6% | 27.2% |
| North Carolina | 66.08% | 33.84% |
| North Dakota | 68.99% | 30.89% |
| Ohio | 67.1% | 32.71% |
| Oklahoma | 58.63% | 41.31% |
| Oregon | 63.99% | 35.92% |
| Pennsylvania | 67.86% | 31.99% |
| Rhode Island | 81.99% | 17.89% |
| South Carolina | 69.24% | 30.7% |
| South Dakota | 61.81% | 38.09% |
| Tennessee | 69.11% | 30.8% |
| Texas | 68.77% | 31.06% |
| Utah | 64.51% | 35.37% |
| Vermont | 72.9% | 26.93% |
| Virginia | 69.19% | 30.59% |
| Washington | 64.76% | 35.05% |
| West Virginia | 65.88% | 33.91% |
| Wisconsin | 64.47% | 35.41% |
| Wyoming | 58.94% | 40.74% |