

Did you know that up to a half of your web traffic may be generated by bots and crawlers? This is one of the findings you can learn in the latest edition of The Mobile Web Intelligence Report based on mobile web traffic in Q1 2016. Here’s what we reveal in the report.
MJ12 bot was more active than Google bot
Web crawlers, the ones that automatically scan online content, are deeply ingrained in the online world so that you may be unaware of the amount of web traffic these “machines” generate. Google Analytics by default doesn’t report on bots and crawlers so that you may not be able to see the entire share of non-human traffic. Device detection tools, such as DeviceAtlas, can provide you with a full report on all website visits generated by web bots and crawlers.
We investigated web traffic in Q1 2016 for all countries tracked to learn about the share of traffic generated by bots and crawlers. Generally speaking, non-human traffic was on par with human traffic at nearly 50%. Here is the breakdown of traffic by the source type.
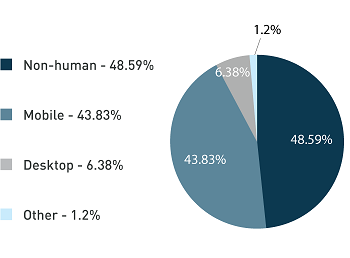
Interestingly the most active bot was the Majestic-12 crawler exceeding Google, Bing or Yahoo! Check out the list of most popular bots in this blog post.
Android grew faster than iOS
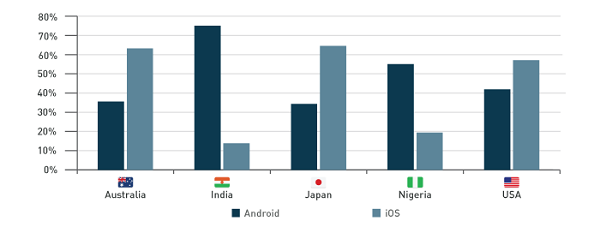
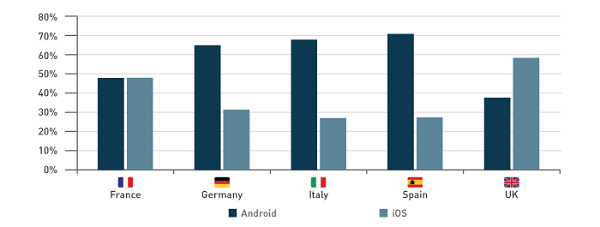
In the Q4 2015 report we ran a thorough analysis comparing the share of web traffic generated by Android and iOS. In 2015 Android was more popular than iOS in terms of web traffic but the Q4 report found that iOS grew faster than Android.
The latest comparison of the most popular mobile OSes for Q1 2016 revealed that Android maintained its leading position and grew its share in most countries we analysed including Australia, France, Germany, Italy, Japan, South Korea, UK and USA. Android’s growth in these countries during Q4 2015 and Q1 2016 oscillated between 0.5% and 6.5% depending on the country. During the same period iOS lost some traffic share in countries we analyzed.
Larger screen sizes are gaining traction
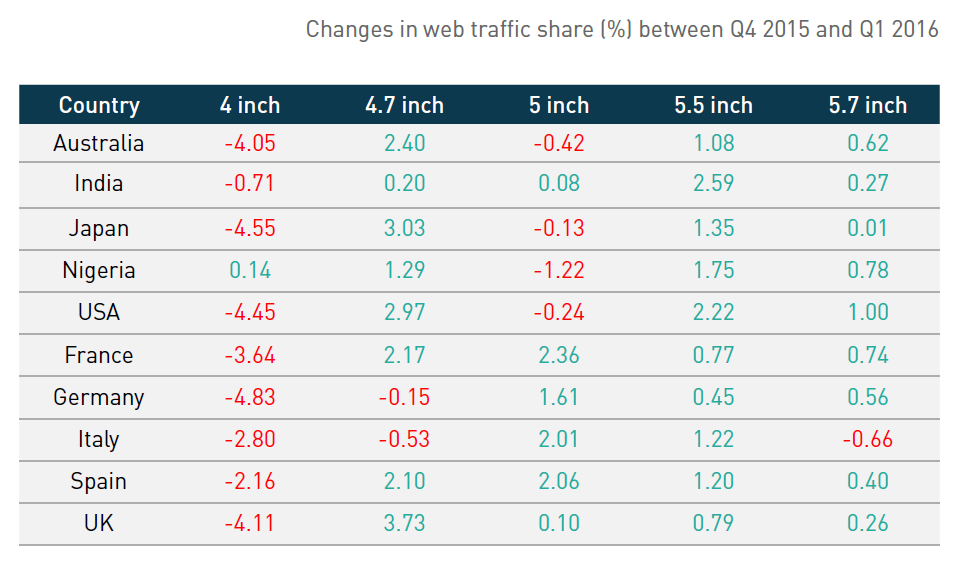
In the last few reports we talked about the most popular smartphone screen sizes. While most flagship devices are now 5 inch or larger, smaller phones were generating much more web traffic.
This trend changed in the Q1 2016 report which saw larger phones gaining traction in many countries. 5 inch phones had the largest share of web traffic in India, Nigeria, Italy and Spain. Also larger phones gained web traffic share in most countries, while smaller phones lost some share during Q1 2016.
Other topics covered in the Q1 2016 report focus on screen resolutions, year released for mobile devices as well as NFC and LTE phone popularity.
Click the button below to download the report.