


The average cart abandonment rate in 2025 is 70.19% - that’s 70 out of 100 customers not checking out. It can be incredibly frustrating for retailers if they don’t know why these sales are lost. We analyzed over 200 blog articles to understand the main drivers of cart abandonment on eCommerce sites/apps. While factors such as high shipping costs, a lack of payment options and website trustworthiness are often the biggest contributing factors, two thirds of these articles specifically mention user device as being a barrier to purchase completion. Interestingly, a further 11% claim that website/app optimization is critical to increase conversions.
Mention of user device is mostly related to cart abandonment rates and their variation by device (mobile vs desktop vs tablet). Though surprisingly, less than 2% of the 200+ articles we analyzed made any correlation between cart abandonment rates and device capabilities, or the ‘why’ – why does this happen? The research focuses primarily on user behavior independent of the device, but users and devices should be explored in tandem; this is a significant gap.
A link between device capabilities and cart abandonment?
Establishing a relationship just based on device type (i.e. desktop, mobile, tablet) vs visitors that do not convert will not be the most revealing insight in understanding cart abandonment among particular devices. Knowing whether more visitors bounce on phone vs tablet is of course important, but it’s possible to go a layer deeper than that if we look at the metadata.

More than half of all web traffic comes from mobile devices, and almost 90% of US consumers have shopping apps installed on their phones. Despite this, cart abandonment rates on mobile is around 85%. While it’s fair to assume that mobile phone activity is more likely to result in sporadic online spending, what do we know about the actual devices themselves? Are these high-end phones or low budget phones? Do they have 7-inch screen or a 5-inch screen? What OS version are they currently using? How new/old are the phones? There are a multitude of questions we can ask to better understand the correlation between user devices and cart abandonment, yet they never seem to be asked. So we’re asking them now…
Is the device what it claims to be?
Of course the device itself is the most important factor to understand at the broadest level – which devices are abandoning carts? Are they legitimate device visitors? Fraudulent traffic is becoming increasingly problematic for any business and eCommerce retailers are no exception. Due to IVT (invalid traffic) in eCommerce, retailers lose an estimated $5.7 billion billion due to bots abandoning carts. According to Pixalate's report, 20% of mobile app traffic is fraudulent and advises retailers to be vigilant towards any spike in this traffic.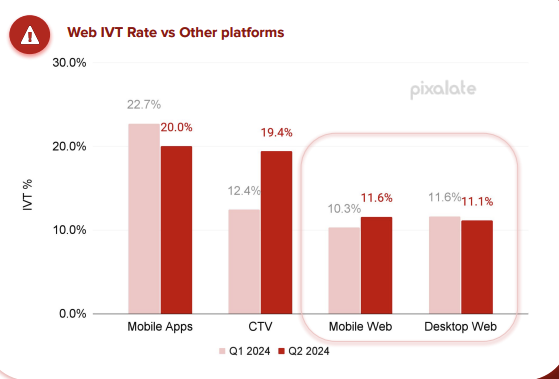
Source: Open programmatic invalid traffic ("IVT") trends; quarterly data from Q1 2024 to Q2 2024; global; as measured by Pixalate
DeviceAtlas also carried out an internal analysis of web traffic vs how major analytics platforms report on it. We uncovered huge discrepancies in IVT that’s not even visible to these analytics platforms, one example being browsers that don’t run JavaScript and subsequently fail to download the fall-back static image – thus they are not even identified by the analytics platform.
The same research also identified a proportion of misrepresented traffic; 4.9% of mobile devices visiting the test website in question were not what they claimed to be.
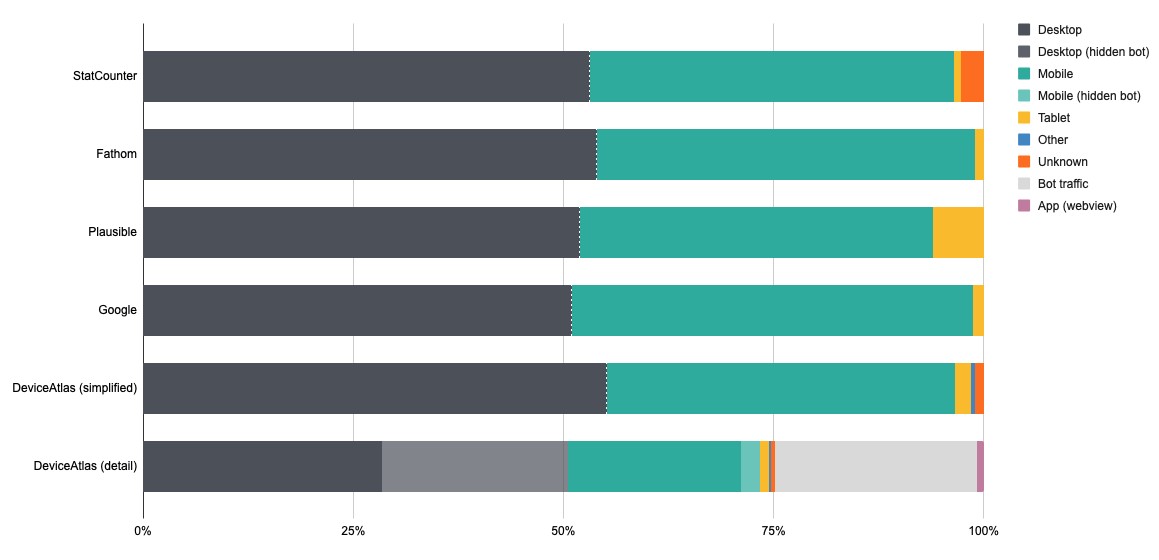
Key takeaway: Consider the authenticity of devices visiting your website and the accuracy of the analytics platform used to measure device traffic. Can you determine the difference between genuine cart abandons and IVT?
How big is the screen?
The average size of a laptop screen is between 14-17 inches, fairly standard across many manufacturers, while the average screen size of a mobile phone (of those released in 2025) is 6.3-6.5 inches. For tablets released within the same time frame, the average screen size is 9.2 inches. Computer monitors, which are used either for desktop machines or projecting from laptops, have the largest screen sizes averaging anywhere from 15-34 inches. These differences are significant and a website will look very different on each of these devices.
According to Barilliance, “the smaller the screen size, the higher likelihood of abandoning the purchase.” This makes sense when we consider the high bounce rate that occurs on mobile phones. The advice given to combat this is to optimize for mobile visitors – but what does that mean when we consider that even among mobile phones the screen size can vary? For instance, the Xiaomi Mi 2 has a 4.3-inch screen vs the Samsung Galaxy Z Fold4 which has a 7.6-inch screen – both are mobile phones that need to be optimized for, but the screen size difference is 3-inches. This occurs even among the same manufacturers; the iPhone 13 Mini 5.4-inch vs an iPhone 16 Pro Max 6.9-inch screen, for example.
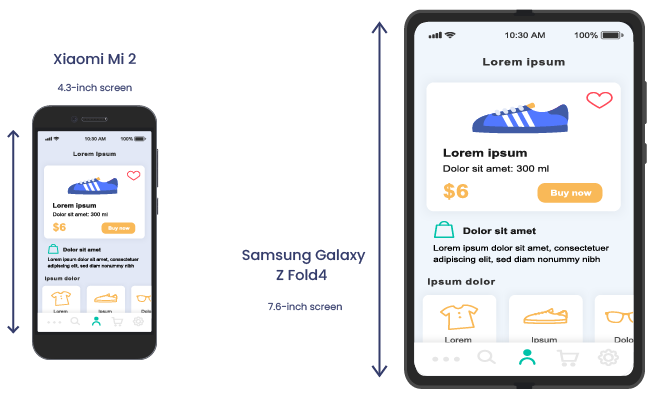
Key takeaway: Consider the difference in screen size between devices and how shopping experiences could be tailored to suit each of them.
What’s the standardized device name?
Knowing the names of devices that result in cart abandons is also an important factor to consider, yet one which is never mentioned when we talk about mobile cart abandonment. Platforms like Google Analytics may be able to identify that X number of iPhone visitors abandoned their carts in a given month, but there’s no breakdown of that number between specific models. So all we know is that these bounces happened on an iPhone; little insight can be taken from this.
Wouldn’t it be more helpful to establish patterns based on specific device names? e.g. identify that the highest number of cart abandons came from an iPhone 16 or an iPhone 16 Pro Max? This level of reporting can more accurately identify opportunities for focus – is there a wider problem with accessibility from iPhone 16 devices that is not currently being addressed?
It’s important to note that Apple has always concealed the iPhone / iPad version from the web server that it is visiting, therefore a more robust device intelligence solution would be needed to uncover these insights about device name. See the image below regarding our own website data according to Google Analytics: iPhones account for over 20% of device traffic yet we have no other information about these devices without utilizing our own internal solution.
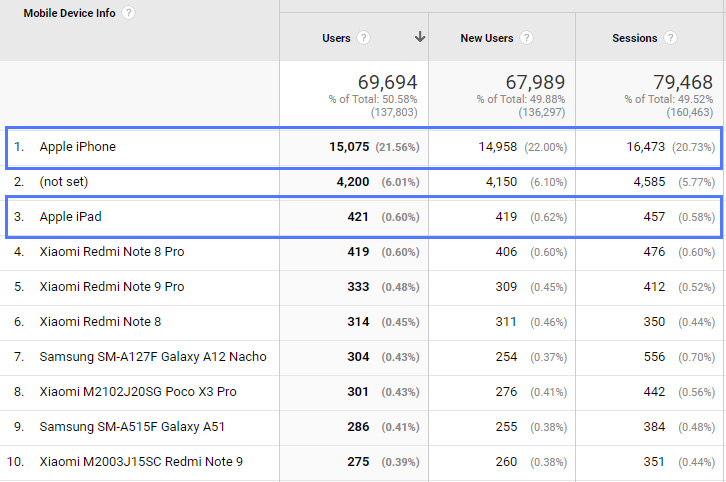
Key takeaway: Consider the importance of standardized name, particularly among Apple devices, and whether any insights can be uncovered that link those users to cart abandons.
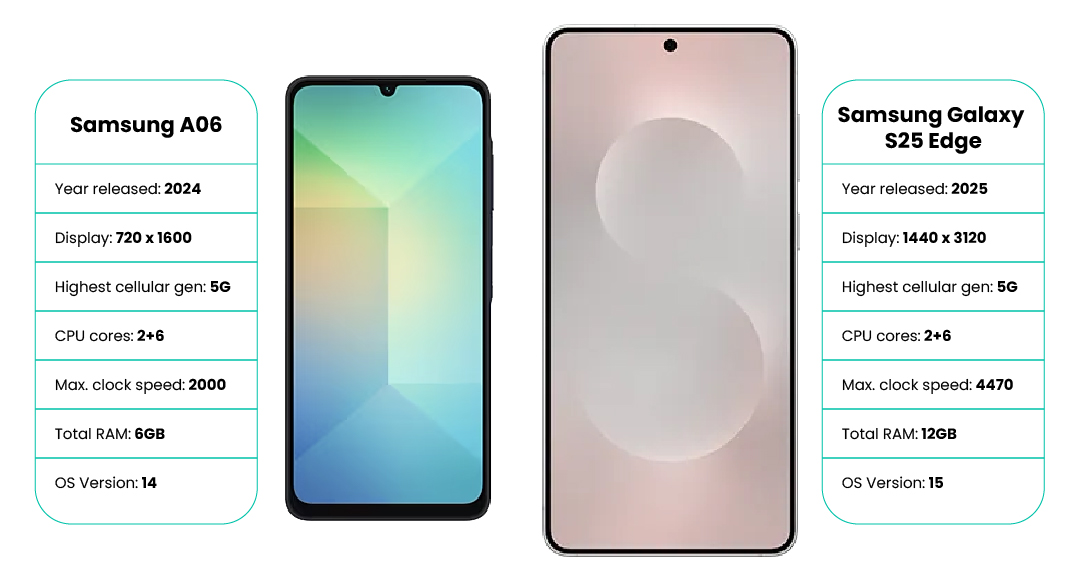
How old is the device?
How old are the devices visiting your website/app? Year of release is a strong indicator of device capabilities and particular specifications, yet it’s rarely mentioned. Newer manufactured mobile phones (excluding budget models) tend to have more RAM, faster processors, higher cellular generation, and better screen resolution. All of these factors can impact how eCommerce webpages are shown to visitors.
Some important questions to ask might be:
- 1. Is the content that you serve image heavy?
- 2. Do you know what your average page weight is?
- 3. How does your site load on a Samsung Galaxy A3 (2014) with 4 cores and 4G capabilities, compared to a Samsung Galaxy A23 (2022) with 8 cores and 5G availability?
The user experience can differ hugely when it comes to image loading and video rendering – activities that are commonplace on eCommerce websites. Unoptimized images are also the worst offenders of page bloat, often unbeknownst to site owners.
Responsive vs adaptive design
It’s also important to note that responsive design, while it may seem like the answer for optimization across multiple devices, does not change the page size per device. So if the Samsung Galaxy A3 user is visiting a retailer’s website, although the design may be responsive for mobile, the page weight will be no different than what it is for the more powerful device, the Galaxy A23.
None of the 200+ articles we analyzed mentioned this, nor was there any encouragement to choose adaptive website design (AWD) vs a responsive website design (RWD). Load times are dramatically reduced with AWD, yet this is hardly talked about when it comes to eCommerce web design – perhaps even ironic was the fact that, while 11% of the articles we analyzed claim websites crashing / latency issues directly contribute to cart abandonment, none mentioned the fact that RWD serves the exact same content across all devices despite the fact that they have varying capabilities, and could actually make matters worse.

Key takeaway: Year of release is a good indicator of performance and an opportunity to establish a correlation between cart abandons and device used. Also consider the benefits of AWD over RWD to ensure visitors are getting the best experience possible depending on the device they’re using.
Which OS version is it running on?
Unlike Apple’s iOS, which is far more easily maintained and controlled, the Android hardware space is very fragmented – according to Device Map data, there are 25,000 unique Android mobile phones and tablets in the world from 1,448 different manufacturers. This makes keeping up with OS versions incredibly tricky for app developers!
Some visitors who use an Android device and experience app crashes or high latency may have an older OS version that needs to be updated. Without knowledge of the OS version from the device, it’s impossible for app developers to know whether the OS version may be causing performance issues for the visitor. Despite this, we know that app crashes are certainly a reason for visitors to abandon carts – even delays as brief as 100 milliseconds can increase mobile bounce rates by 50%. One article in particular we analyzed, which mentions crashes/latency as one of 8 drivers of cart abandonment, made specific reference to cross-browser and cross-device testing to check compatibility. Wouldn’t it be great if you could pinpoint which devices were experiencing app crashes, identify any potential bugs/issues from the OS version running it and then notify that user to inform them that they should update their OS for a better experience using your app?

Key takeaway: Knowing the OS version of devices using apps may be extremely beneficial when crashes/high latency occurs. Developers get much better visibility on where certain issues lie and whether the problem may be internal or related to device incompatibility due to outdated OS versions.
Conclusion
Knowledge of the device is critical in understanding eCommerce cart abandonment. So much of the research carried out on this topic mentions the impact that the device has on cart abandonment, yet very little about the actual devices themselves seems to be explored. Retailers have a real opportunity to reduce cart abandonment by asking the above questions and establishing a connection between those and the devices that do not convert. Remember, users and devices are not independent of one another.