

In January, Samsung announced their much-anticipated S9 will be revealed at the Mobile World Congress, taking place in Barcelona between February 26th and March 1st. With sales of the unit expected to begin in March, we’re excited to see how the latest addition to the Android camp might affect global trends in mobile use.
With that in mind, we’ve looked back on 2017 to see where the perennial Android v iOS battle was won and lost.
Mobile – Calmer Waters Than 2016
While we saw some huge fluctuations in last year’s report, such as Android losing 24% share in Indonesia while iOS gained 34%, 2017 proved less alarming overall.
Notable gains include a 6% iOS increase in Brazil, up to 31% of the overall share, cutting slightly into Android’s impressive 70% 2016 share.
The country which saw the smallest change in overall OS share was Sweden, where Android (48.5%) and iOS (50.7%) continue to dominate the scene. In 2016, those figures were 48% and 50% respectively.
Gains in web traffic share (2016 vs 2017):
| Android (change in traffic share) | iOS (change in traffic share) |
|---|---|
| Australia +1% | Argentina +3% |
| Canada +2% | Brazil +6% |
| France +4% | Italy +2% |
| Germany +4% | South Africa +4% |
| UK +4% | USA +4% |
Losses in web traffic share (2016 vs 2017):
| Android (change in traffic share) | iOS (change in traffic share) |
|---|---|
| Argentina -1% | France -3% |
| Brazil -5% | Germany -3% |
| Ireland -1% | Russia -5% |
| Italy -0.5% | Spain -2% |
| USA -4% | UK -2% |
Tablets – March of the Androids
Despite tablet sales declining for 11 quarters in a row (according to IDC’s sales figures), tablet usage remains strong as there's less incentive to update such devices as regularly as their mobile equivalent.
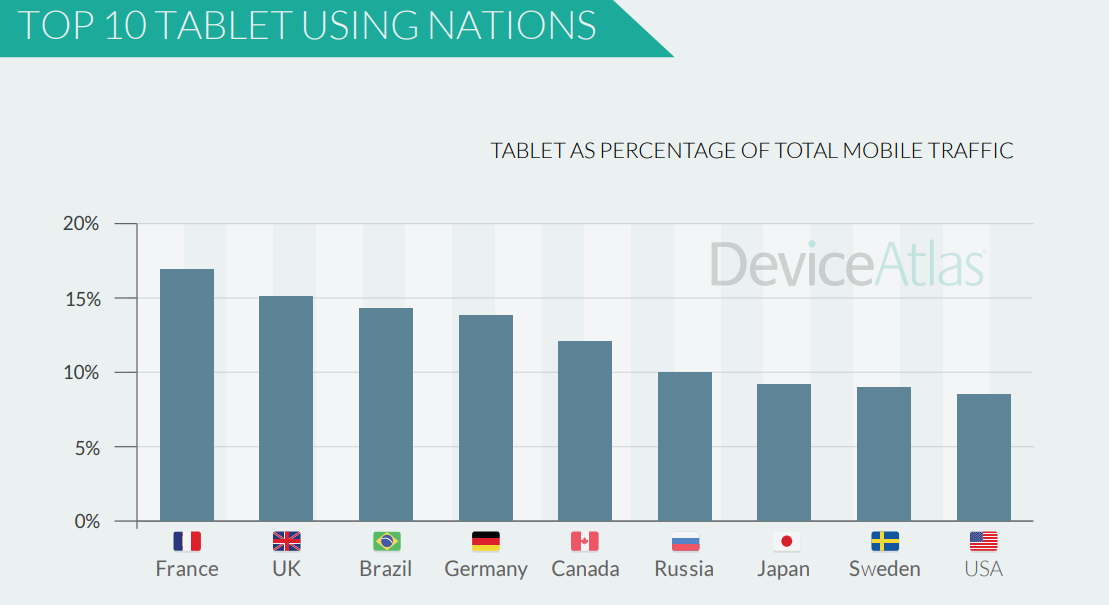
Above, we can see which countries have the highest Tablet usage (as a % of overall mobile traffic). What the underlying data shows, however, is a strong year for Android-powered tablet devices across all countries, with major gains into Apple’s suite of devices throughout the year.
Android Tablet Share 2016 - 2017:
iOS Tablet Share 2016 - 2017:
This suggests an abundance of lower-end Android tablets entering the market across the globe, while iPads retain their “luxury” status - and pricepoint.
Still hungry for stats? Check out these other articles, or download the latest Mobile Web Intelligence Report below.