The Importance of Device Graphs in Streaming Services
Device fragmentation makes user behavior unpredictable. Globally, the average person has 3 connected devices: what does this mean for streaming service providers? How can they tell these devices apart? In this post we look at the importance of device graphs and the importance of being able to tie device information to subscriber information.

In 2012, Netflix had only just branched out across the Atlantic to a wide-eyed European market. It would be another 4 years before Amazon Prime Video subscriptions were readily available worldwide and Disney+ wouldn't exist for a further 3-4 years after that. Now in 2022, it's difficult to imagine a world without streaming platforms & Netflix, Amazon Prime Video and Disney+ have a combined subscriber count of 533 million (though unlikely all unique subscribers as many people hold streaming subscriptions with multiple providers.
Chain of Devices
Device fragmentation is more apparent now than ever before, with top streaming providers offering content on more devices across multiple platforms. TV screens accounted for 73% of all streaming devices during Q2 in 2021 (this may seem disproportionate but includes Smart TVs, CTV devices and Gaming Consoles that are streaming through a TV screen) - see below for the full breakdown:
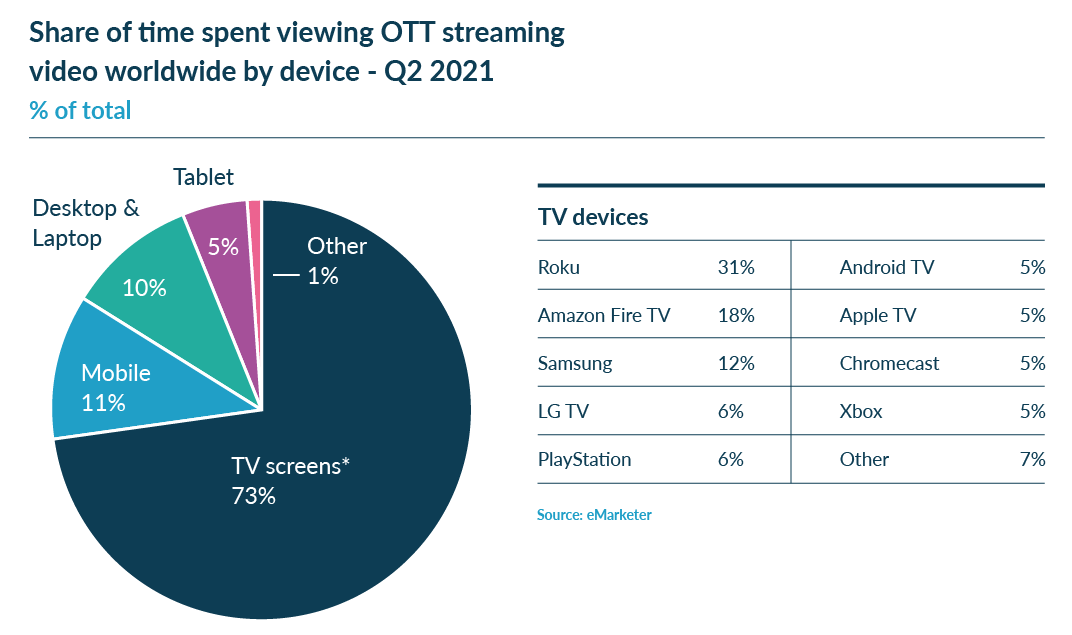
The above graph identifies just how much choice is available to subscribers when deciding which device to use at a given time. What's significant about that is the ability to access a streaming service through one account via a chain of different devices. Head of Product at DeviceAtlas, John Leonard posits that: "Streaming Service Providers are engaging with subscribers through their devices. Since the device capabilities govern the quality of experience, knowledge of the device becomes as valuable as knowledge of the user. It's insufficient to think about a user in isolation."
Why do we need Device Graphs?
If device capabilities govern the user experience, having a record of every device used over time for a specific subscription (enriching that with device intelligence) will offer significant advantages. Many market leading streaming providers are already doing this by tying device information back to subscriber information to improve QoE, directly reduce costs and generate new revenue opportunities. Some of these positive results from device graph insights include:
1. The ability to measure password sharing
One of the biggest issues for streaming providers right now is password sharing. Huge amounts of subscription revenue is lost due to users sharing passwords and allowing others to access content for free. The introduction of Netflix’s ‘Add a Home’ feature in some South American countries is attempting to alleviate this problem by charging users a fee to add an account outside of their household. Of course, this would also require building out a household graph and identifying those based on IP address lookups to determine the subscribers in each household and what devices they are using.
[ source ]
Though one possible consequence of the ‘Add a Home’ policy could be user-agent switching; subscribers may attempt to change their user-agent string (what identifies their device) in order to bypass the household’s device limit. However, if a streaming service provider utilizes device intelligence within its tech stack, it can enforce the device limit by identifying not just whether a device accessing content matches those on an ‘approved list’, but also whether a different device is masquerading as a device on the list.
Pirating copyrighted content and redistributing it will also be a concern from a digital content protection perspective. In this case, it’s likely that the device will be inauthentic, i.e. not what it is claiming to be. By tying this information back to the user, the account can be suspended when such events occur and other appropriate steps taken.
2. Engaging in highly targeted customer communications
If a streaming provider can differentiate between subscribers using particular devices, i.e. Panasonic TVs vs Roku players vs Xbox consoles, etc. they can offer specific messaging based on those devices, e.g. content recommendations or promotional offers. Identifying these devices also supports the creation of fine-grained segments for ad targeting, getting the right ads in front of the right viewers. Ad monetization is becoming increasingly appealing to streaming services - in December, Disney+ plans to introduce an ad supported version to its services and increase the price of ad free subscriptions to $11 per month (currently a monthly subscription costs $7.99 so these changes would result in a 38% price increase).
[ source ]
3. A better understanding of device diversity
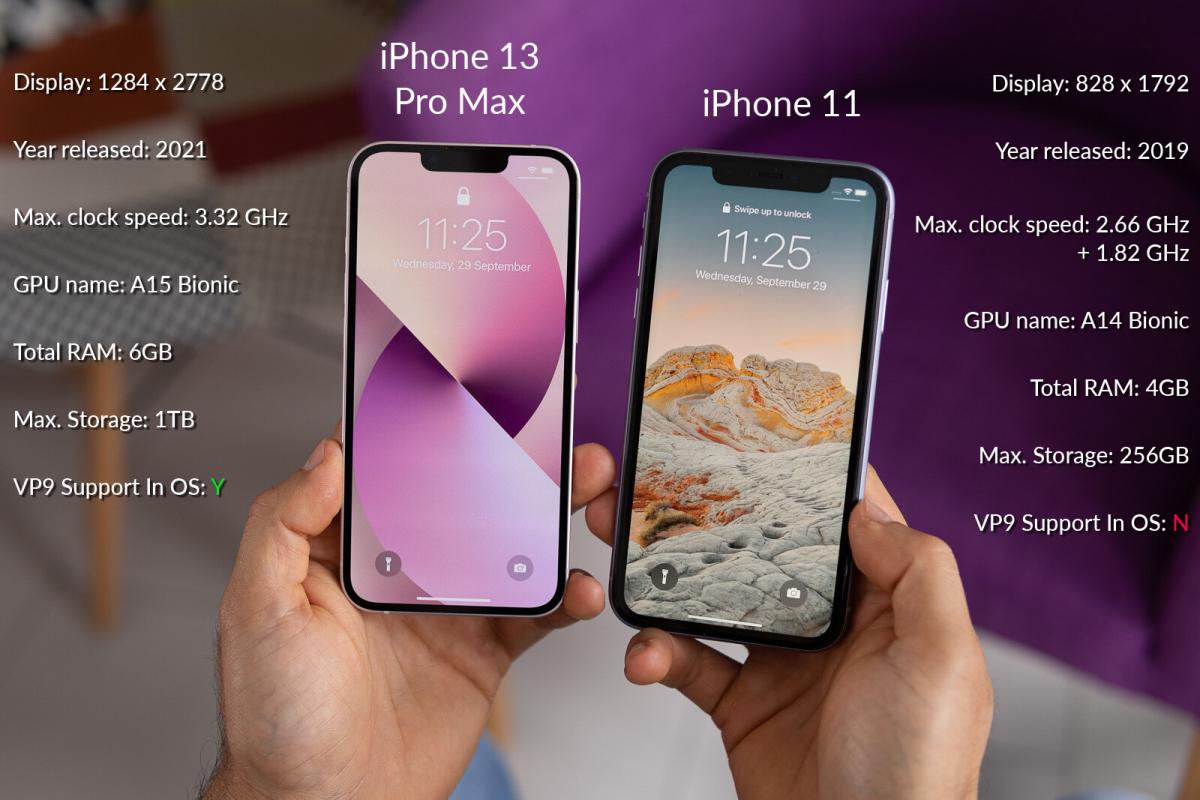
Mobile devices are becoming more and more diverse over time – smartphones are not a homogenous category and can range from $50 to $1,500 in price with varying hardware attributes. Building out a device graph for each subscriber and also having a deep understanding of those devices will allow streaming providers to offer optimum experiences and ensure a positive QoE. Some of these capabilities will include things like device type & model, screen size & resolution, GPU name, year released, CPU cores, H.264/H.265/VP9 support in OS, RAM, bit architecture, etc.
Based on recent data insights from DeviceAtlas, there are huge variations in the capabilities of iPhones, even ones that have been manufactured only a few years apart. Let’s consider the iPhone 11 vs iPhone 13 Pro Max as an example. The difference in capabilities between these models alone demonstrates the power that device intelligence offers when it comes to building device graphs – this is also significant when we consider that Apple has traditionally concealed the iPhone version from the web server it’s visiting, making it challenging to decipher much information about it (unless a specialised device intelligence partner is used).
Implications in a Cookie-less World
It’s also important to note that as we enter a time of increasing privacy sensitivity, as well as the upcoming changes to Google’s cookie policy, device graphs become even more critical for Streaming providers. Knowledge of a device as a contextual signal will increase in value, and with third-party cookies going away, it will be important to factor in all contextual data when making marketing decisions. For example, entry level vs premium devices enable assumptions about disposable income when making offers or recommendations, and age of device may also indicate propensity to adopt the latest technologies. Device type indicates user context and that is incredibly powerful. Ultimately, to know your customer means knowing the device that they’re using.

Conclusion
Devices are the means of engagement between streaming providers and consumers. Yet the increasing complexity and fragmented nature of the device landscape makes it difficult to truly understand them and how they are consuming digital content. Knowing each specific device that is tied to a subscriber’s account and acknowledging the correlation between user behavior and device capabilities will lead to competitive opportunities and close that QoE gap.

